
Lately we have been setting up the production network for our Zolder.App service. The network consists of multiple segments separated by a firewall. Only connections are allowed between the segments that are necessary. The goal: minimize the impact if an attacker succeeds in compromising a system inside the network.
As an addition we wanted to add monitoring features into the network. If an attacker is in our network, we would like to get a notification. One of the things I usually like is adding a device that is able to detect port scans. It’s a device for ‘honey’ purposes, whenever it gets touched on any port a notification will be sent that something weird is going on.
So, how to implement this? We do have many segments. It would be inefficient to add devices (virtual machines) in every segment for just this purpose. Also we don’t want just one honey device connected to all segments, because this would be a single point of failure on successful compromise of that machine.
Think about it 😊
After brainstorming for a while I got an idea that made me quite excited. In our network we do have a firewall (pfSense). This firewall is already aware of any passed and blocked connections going on between the different segments. So the idea was: isn’t it possible to use the information that we do already collect? This would be much more efficient as we don’t need to add devices. But also much more effective, as we can see every connections across our network. Its important to note that connections within VLAN’s remain unseen.
Fix the logging
First, we need to get our passed and blocked connections logged by the firewall into a system that allows us to query the data. We use Azure Sentinel a lot for our services and research, it’s a cloud-based SIEM that has many powerful capabilities. We decided to write our firewall logs to this SIEM. The pfSense firewall is writing its logfiles to a rsyslog server. The rsyslog server is forwarding the information to the Azure Sentinel syslog agent. After a while, we got our pfSense blocked and passed connections logs in Azure Sentinel:

Build a query
We do have the data in Sentinel, its time a to build a query. I did have multiple requirements for the query. For our own purposes, but also for others to use our query. It’s important to have that flexibility, as every network is different. I had the following requirements:
- the IP-addresses/ranges being monitored can be defined in the query
- a threshold can be defined in the query per monitored IP-address/range
First, some explanation on above requirements. Let’s assume that our network looks like this for our example:
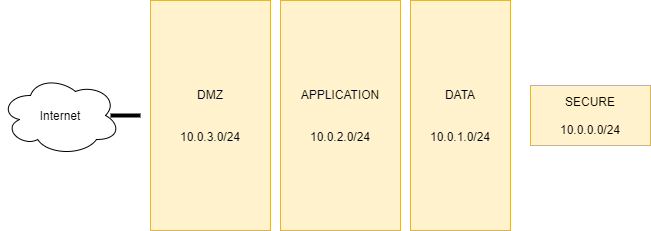
Above image shows an example network design of our network. We do have multiple segments. Monitoring the segments might have different priority. In above image, the “secure” VLAN is the most important. We want to perform very actively monitoring on this segment. We want to be notified on every blocked connection that occurs. For other segments, such as DMZ, we want the query to be slightly less sensitive. For example: we want a notification if more then 50 blocked connections are detected (an actual port scan). The amount of connections detected before an alert is triggered is configurable through the threshold.
After playing around for a while with KQL I created the following query:
// Configure the systems dynamic with the systems or subnets you would like to monitor as the key.
// The value is a threshold on how many blocked connection a alert needs to be generated.
// Example: use zero for crown juwel systems or networks. Use 50 for regular networks you would like to monitor.
let systems = dynamic(
{
“10.0.4.0/24”: 50,
“10.0.3.0/24”: 50,
“10.0.2.0/24”: 50,
“10.0.1.0/24”: 50,
“10.0.0.0/24”: 0
});
Syslog
| extend CSVFields = split(SyslogMessage, ‘,’)
| extend Interface = CSVFields[4]
| extend Action = CSVFields[6]
| where Action == “block”
| extend SrcIp = CSVFields[18]
| extend DstIp = CSVFields[19]
| where DstIp !contains “.255”
| extend SrcPort = CSVFields[20]
| extend DstPort = CSVFields[21]
| mv-expand bagexpansion=array system = systems
| extend cidr = system[0]
| extend threshold = system[1]
| where ipv4_is_match(tostring(DstIp), tostring(cidr))
| summarize amount = count() by tostring(SrcIp), tostring(DstIp), tostring(cidr), tostring(threshold)
| where amount > tolong(threshold)
The full YML can be found here.
By modifying the systems variable it is possible to specify which IP’s or IP-ranges needs to be monitored within the network. For each system the threshold can be configured. These are two variables that need to be adapted to every network in order to work effectively
Within our network we have configured threshold as 0 for our sensitive networks (alert on every connections) and 50 to detect regular port scans, for example nmap -F <host>. We are running the query every 5 minutes on the latest 5 minutes of data coming in from the firewall.
Getting notified
We connected a playbook to trigger an alert. Whenever a detection is done we got an email notification whenever lateral movement is detected within our network:

Happy hunting!
BTW: I also build some queries to detect spikes of blocked and passed connections. I also added these queries to our Github repository. They can detect unusual spikes in network traffic.